Real-Time Geovisualization
Details
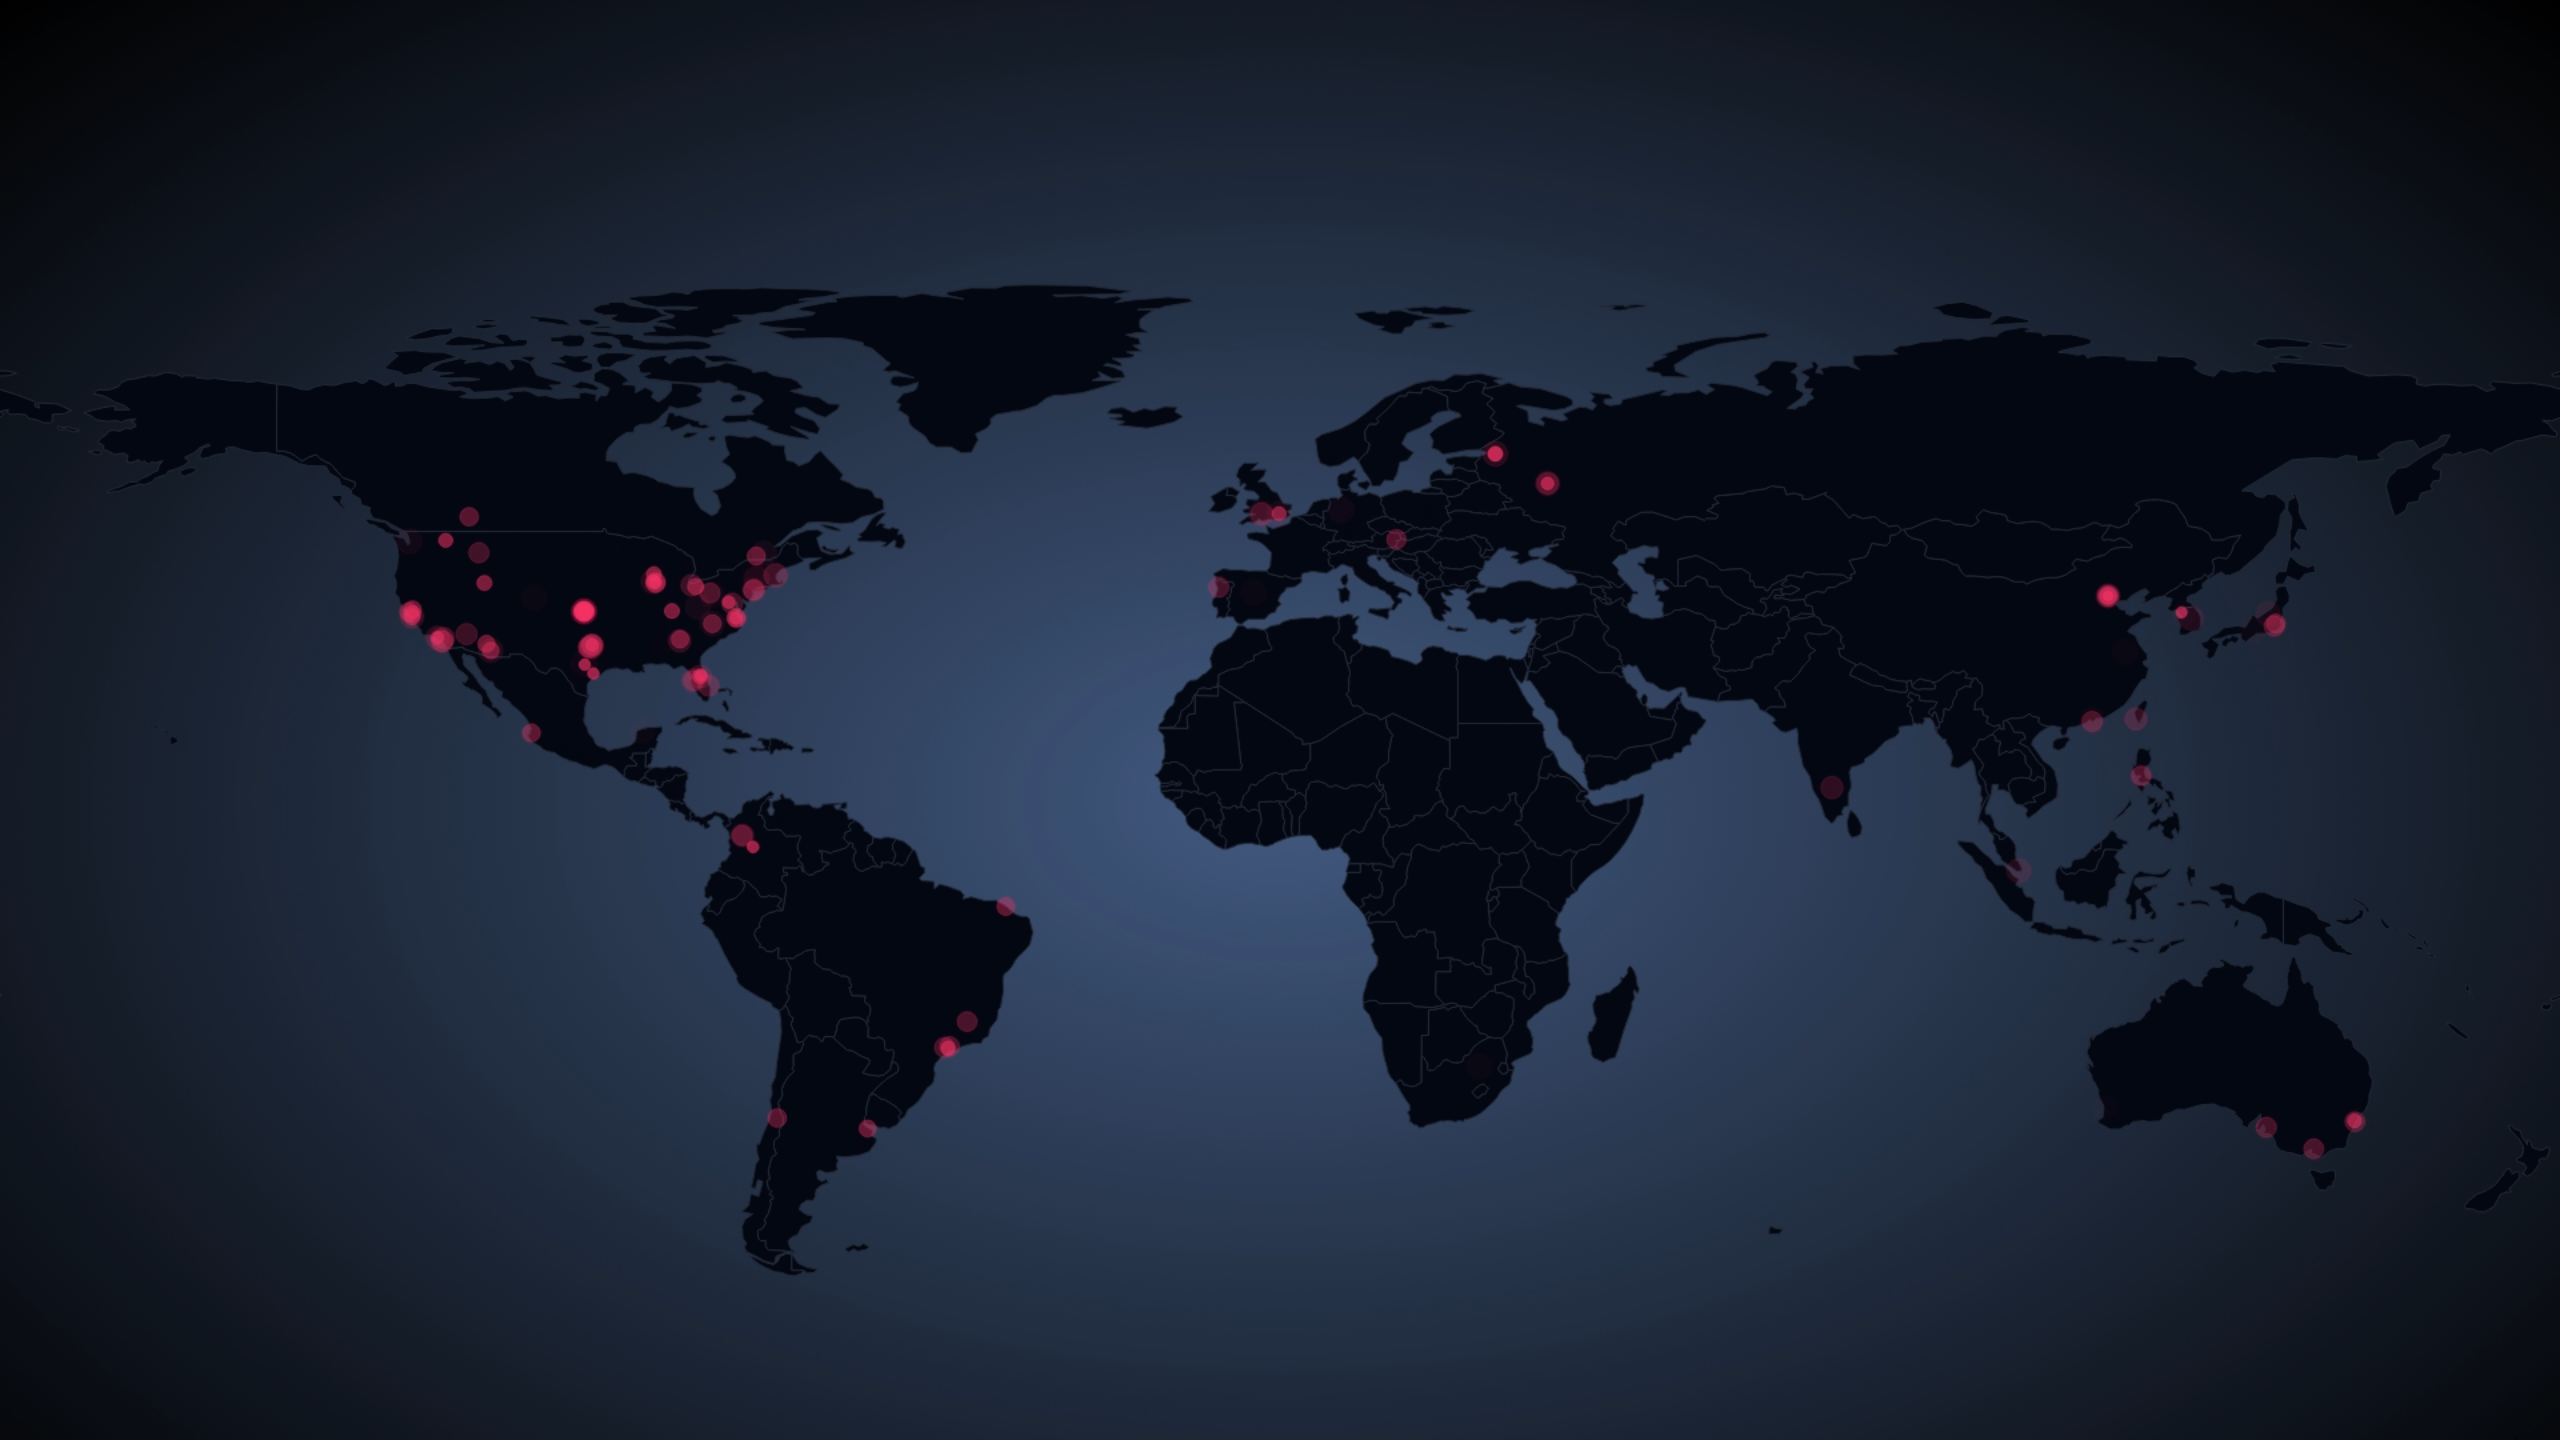
This visualization was built as part of an internal hackathon to showcase where videos hosted on Vidyard’s platform were being loaded in real-time. The sped-up recording above was taken on the morning of December 16, 2018 (EST).
The project consists of three main parts:
- A worker reads from an existing AWS Kinesis stream and emits data to the server for further processing. For context, Vidyard’s video player regularly sends events to an ingestion server which are then put onto various Kinesis streams for other microservices to use.
- A backend server which augments video load data with geolocation information from Maxmind and sends it to all connected clients using Socket.IO.
- The visualization itself which reads data from a socket and renders it on a map (generated using DataMaps). Two additional projections (one for Canada and one for the United States) were included to provide additional clarity for those countries.